> ## Documentation Index
> Fetch the complete documentation index at: https://docs.edisglobal.com/llms.txt
> Use this file to discover all available pages before exploring further.
# VPS Traffic Stats, Metering and Monthly Refills Explained
> Understand the VPS Traffic Information dashboard, how EDIS Global meters traffic, refill cycles, and what happens when monthly traffic limits are reached.
## All about VPS traffic, metering and refills
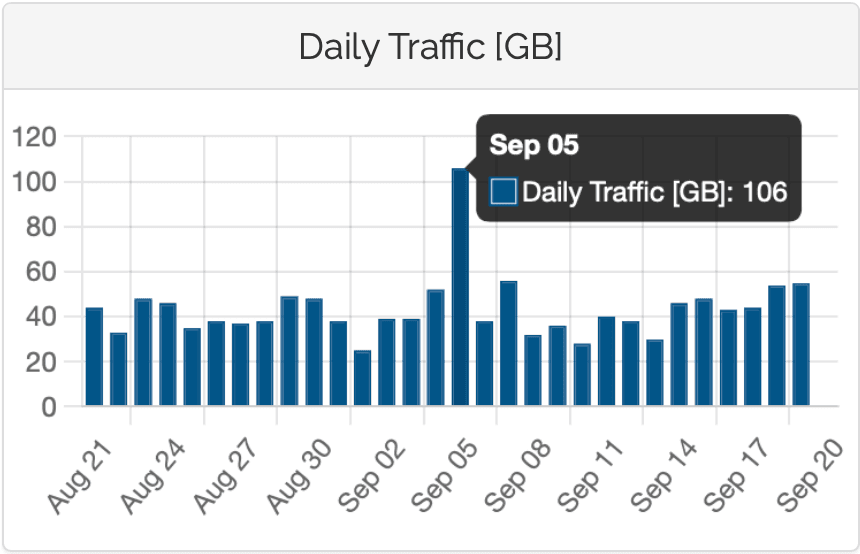
This document explains how to access and interpret traffic information for a VPS through the VPS Management Portal. It includes details on total traffic used, available (remaining) traffic, and monthly reset/refills, as well as a chart showing cumulative traffic and days remaining until the next refill. Users can also view daily traffic data for every VPS.
### Access your VPS traffic information
To access your VPS traffic information:
[VPS Management Portal](https://manage.edisglobal.com/clientarea.php)
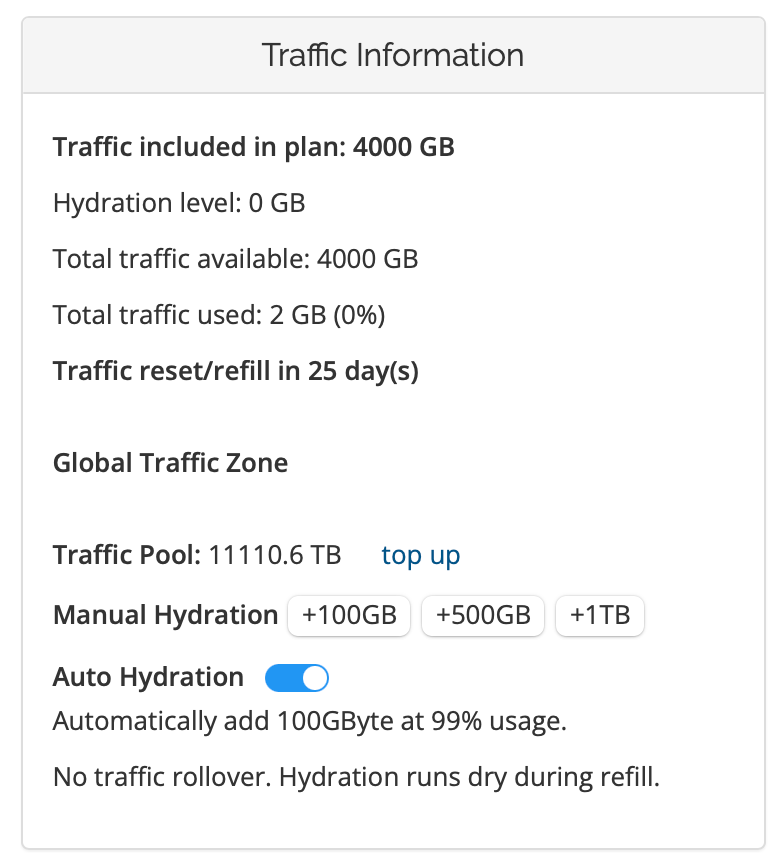
Review the "Traffic Information" window at the top right.
 ### Total traffic used
The total amount of traffic (GB and percentage) consumed since the beginning of the current **monthly** service timeframe.
### Total traffic available
The total amount of traffic included in your plan for a 1-month period.
### Monthly traffic Reset/Refill
Days remaining for monthly VPS traffic reset. Countdown to when your VPS traffic metrics will be reset and the traffic allocation for your plan is replenished (refill).
### How we meter traffic
EDIS Global measures traffic usage directly on the Ethernet interfaces of your Virtual Private Servers in real time.
Total traffic is calculated as the sum of **ingress (incoming)** and **egress (outgoing)** traffic across the measured period.
$Total Traffic = \sum (\text{IN} + \text{OUT})$
### What happens when all traffic is consumed?
Warnings are sent out at 80%, 90%, and at 100% traffic usage levels. When all traffic is used, your Ethernet interface is throttled to about 64kbit/s. We apply a **5% grace** amount, so the throttling only happens at roughly 105% usage.
There's no overage charge, ensuring your server remains online even if all traffic has been used. There are several options for [restoration](/faq/traffic-bandwidth/traffic-pool) when traffic has been used in full.
### Total traffic used
The total amount of traffic (GB and percentage) consumed since the beginning of the current **monthly** service timeframe.
### Total traffic available
The total amount of traffic included in your plan for a 1-month period.
### Monthly traffic Reset/Refill
Days remaining for monthly VPS traffic reset. Countdown to when your VPS traffic metrics will be reset and the traffic allocation for your plan is replenished (refill).
### How we meter traffic
EDIS Global measures traffic usage directly on the Ethernet interfaces of your Virtual Private Servers in real time.
Total traffic is calculated as the sum of **ingress (incoming)** and **egress (outgoing)** traffic across the measured period.
$Total Traffic = \sum (\text{IN} + \text{OUT})$
### What happens when all traffic is consumed?
Warnings are sent out at 80%, 90%, and at 100% traffic usage levels. When all traffic is used, your Ethernet interface is throttled to about 64kbit/s. We apply a **5% grace** amount, so the throttling only happens at roughly 105% usage.
There's no overage charge, ensuring your server remains online even if all traffic has been used. There are several options for [restoration](/faq/traffic-bandwidth/traffic-pool) when traffic has been used in full.
 ### Exponential traffic chart
We have a chart showing the **total (cumulated) traffic** since the last refill. VPS traffic meters are reset and refilled monthly on your product's key (renewal) date.
There is a small indicator (red arrow below) showing how many days until your VPS receives its next monthly traffic refill. This indicator helps you understand whether you should:
* "Hydrate" your KVM with traffic from your Traffic Pool
* Upgrade to a higher tier
* Wait for the next refill
The red line represents the total amount of traffic available to your KVM. It usually shows the amount of traffic included in your plan. The line moves higher when you add traffic from the Traffic Pool.
### Exponential traffic chart
We have a chart showing the **total (cumulated) traffic** since the last refill. VPS traffic meters are reset and refilled monthly on your product's key (renewal) date.
There is a small indicator (red arrow below) showing how many days until your VPS receives its next monthly traffic refill. This indicator helps you understand whether you should:
* "Hydrate" your KVM with traffic from your Traffic Pool
* Upgrade to a higher tier
* Wait for the next refill
The red line represents the total amount of traffic available to your KVM. It usually shows the amount of traffic included in your plan. The line moves higher when you add traffic from the Traffic Pool.
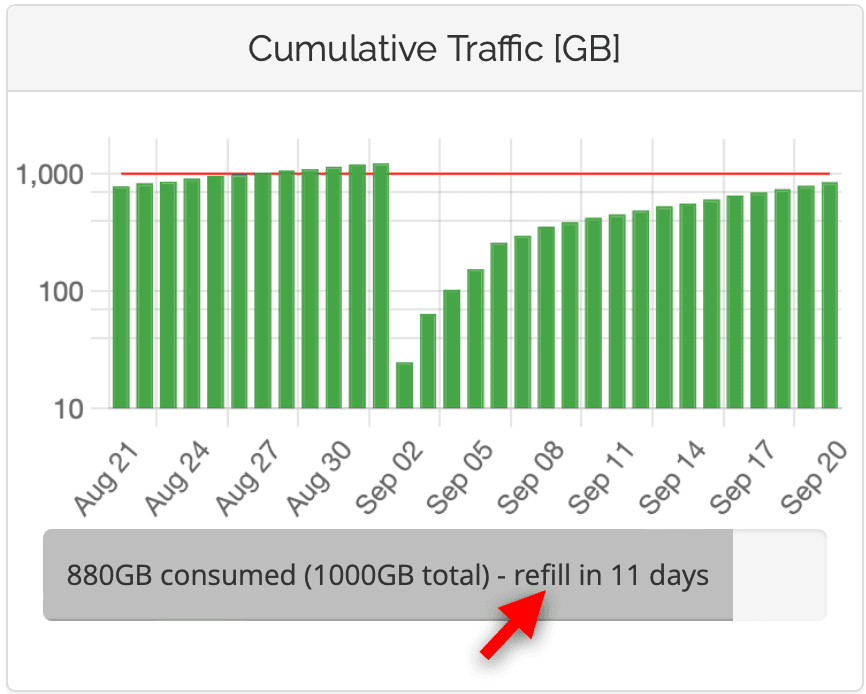 In the panel, hover the mouse over any particular day to get more insights from the readings. Please note that the diagram is rendered exponentially and not linearly.