> ## Documentation Index
> Fetch the complete documentation index at: https://docs.edisglobal.com/llms.txt
> Use this file to discover all available pages before exploring further.
# How to investigate and stop unusual network usage on Linux
> Identify Linux processes using network traffic, distinguish expected activity from problems, preserve evidence, and stop confirmed unwanted activity.
# Detecting suspicious network spikes in Linux servers 🚨
Unusual network spikes often come from background activity you don’t expect. Hidden tasks or processes may quietly use your bandwidth, such as:
* **Rogue scripts:** hidden or leftover commands constantly transferring data.
* **Crypto miners:** unauthorized software using your server’s CPU and network for mining.
* **Misbehaving processes:** normal services stuck in loops or retries, flooding the network.
Spotting these early helps you prevent wasted data, slow performance, and unexpected network costs.
📘 **Related:** Learn the difference between *traffic* and *bandwidth* in [this EDIS Global guide](https://docs.edisglobal.com/faq/traffic-bandwidth/traffic-vs-bandwidth).
***
## 1) Monitor live network activity
Start by checking which IPs or processes are using your network. Two lightweight tools are `iftop` and `nload`.
Before running them, make sure you’re using the correct network interface.\
It’s not always `eth0` (it can be `ens3`, `ens18`, `eno1`, etc.).\
You can find your active interface by running:
```bash theme={"system"}
ip -o link show up | awk -F': ' '{print $2}'
```
Then replace `eth0` in the commands below with your interface name:
```bash theme={"system"}
sudo apt install iftop nload -y
sudo iftop -n -i eth0
```
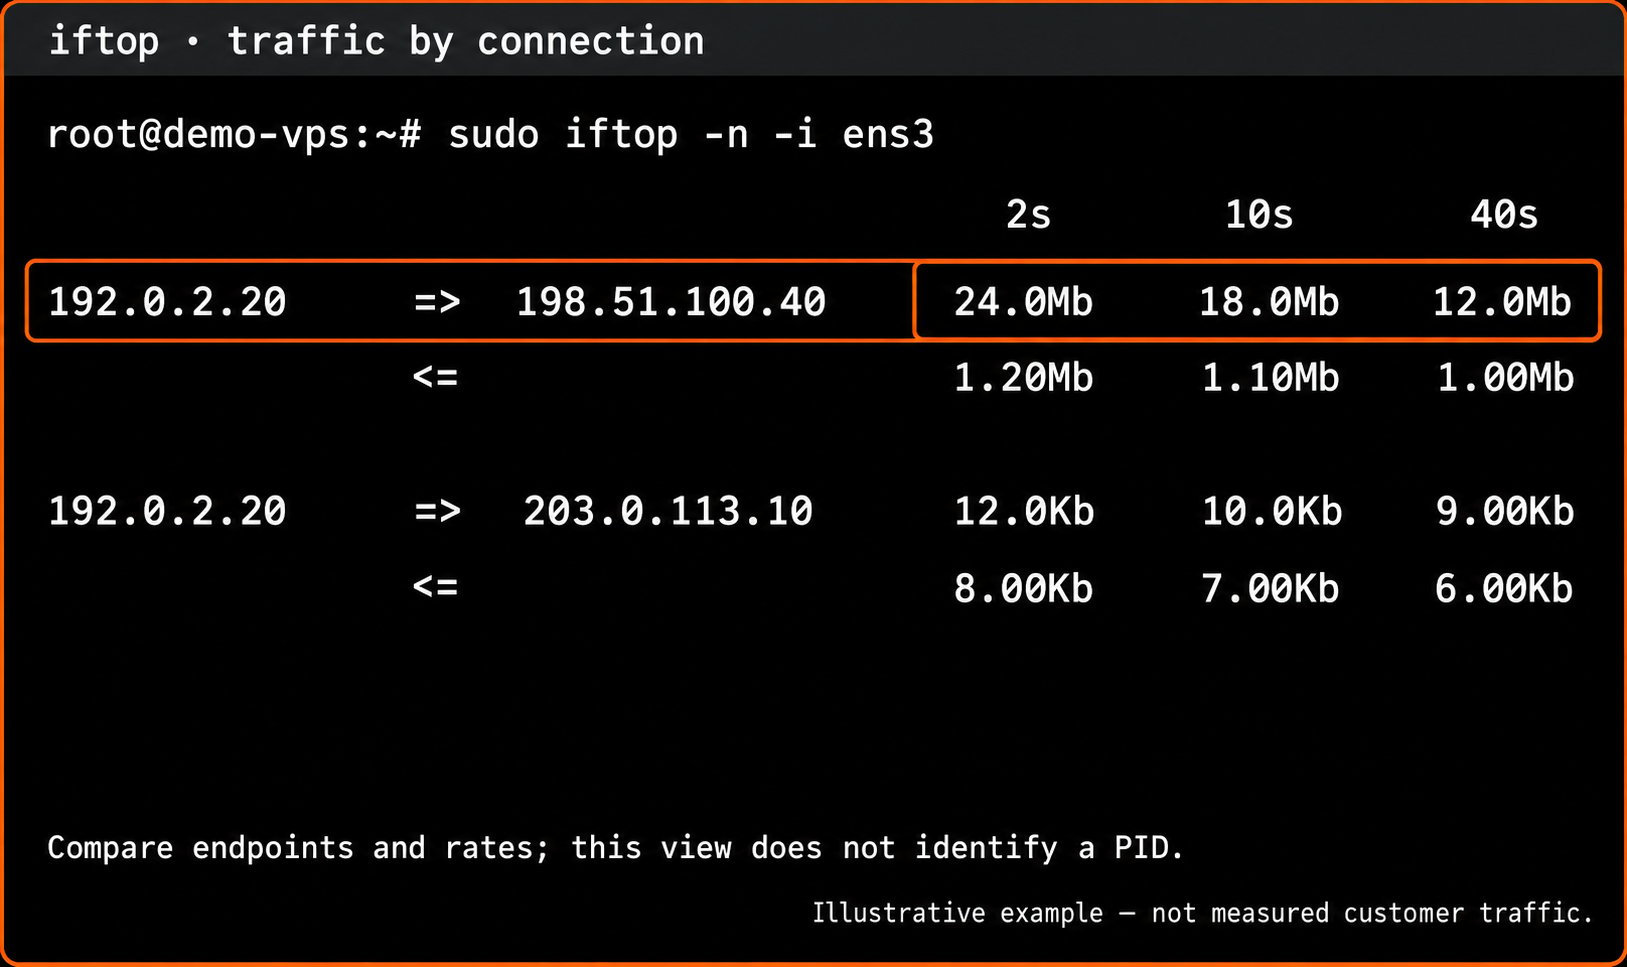
In **iftop**, compare source/destination addresses and traffic rates. The `-n` option keeps addresses numeric so you can match them with `ss` output. Check whether the busiest connections belong to expected activity; an unfamiliar address alone does not establish abuse.
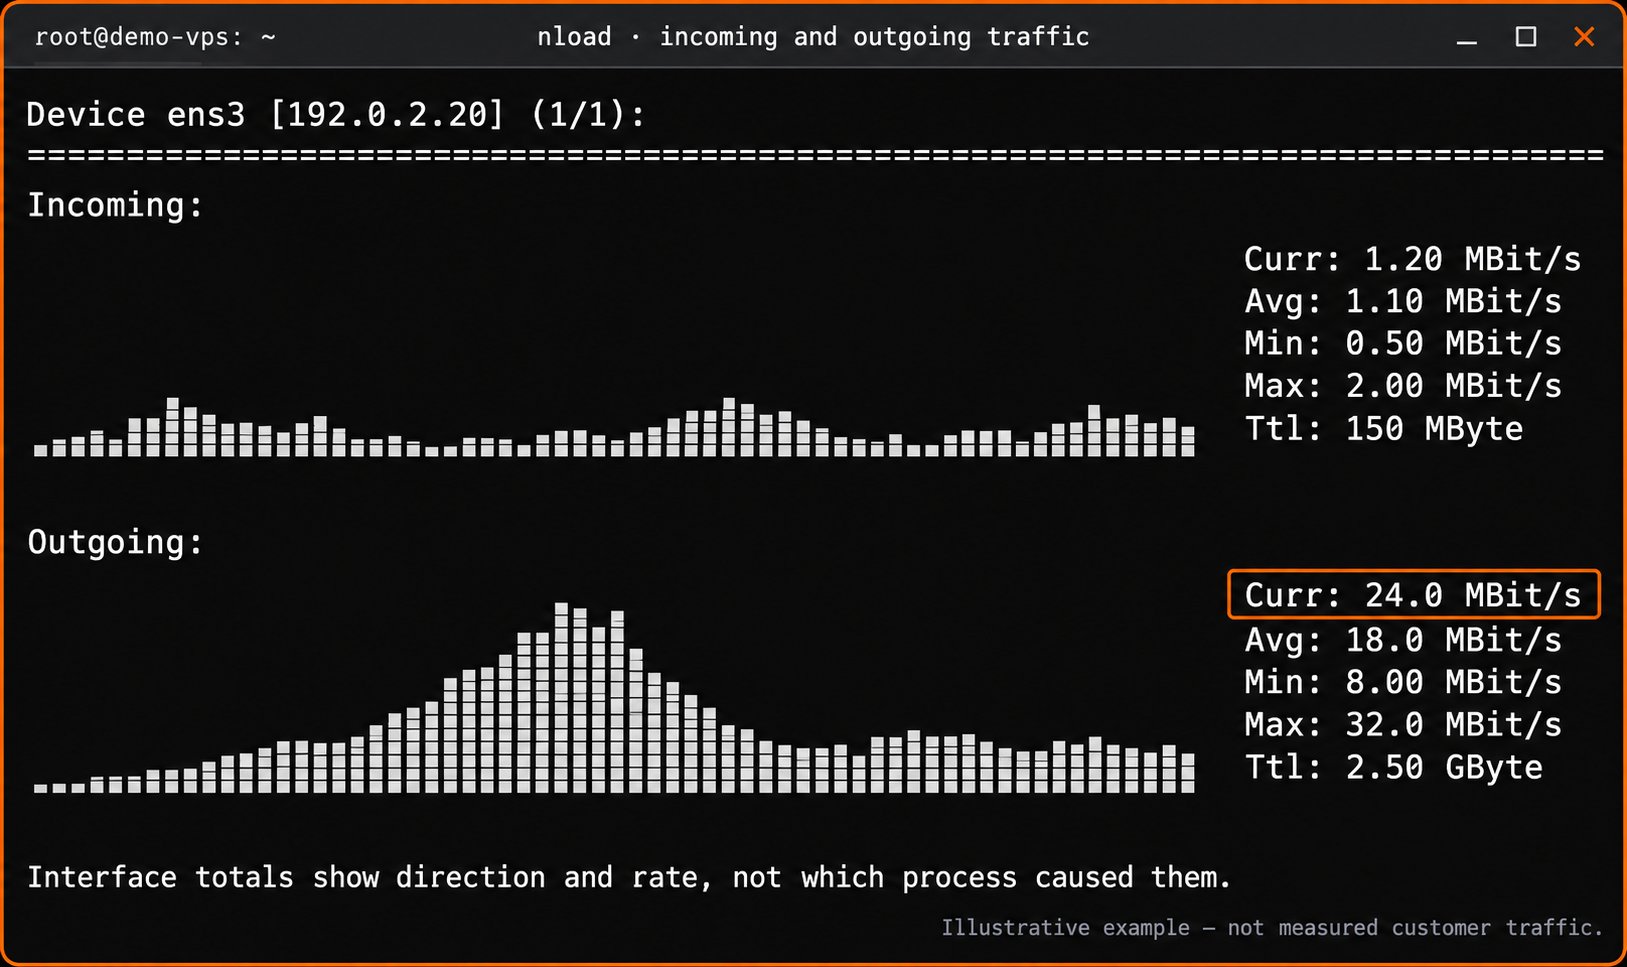
 If you want a simpler graph view:
```bash theme={"system"}
sudo nload eth0
```
If you want a simpler graph view:
```bash theme={"system"}
sudo nload eth0
```
 ***
## 2) Identify which process is behind the network usage
Once you spot unusual network activity, use `ss` (modern) or `netstat` (optional) to find the process behind the connections.
```bash theme={"system"}
# recommended (modern tool)
sudo ss -tupn
```
If you prefer `netstat`, install `net-tools` first:
```bash theme={"system"}
sudo apt install net-tools -y
sudo netstat -tupn
```
In the example below, the peer `198.51.100.40` from the traffic view appears in a connection owned by PID **28799**. The process name is shown as `xray-linux-amd6`; a process name can be truncated in this view.
***
## 2) Identify which process is behind the network usage
Once you spot unusual network activity, use `ss` (modern) or `netstat` (optional) to find the process behind the connections.
```bash theme={"system"}
# recommended (modern tool)
sudo ss -tupn
```
If you prefer `netstat`, install `net-tools` first:
```bash theme={"system"}
sudo apt install net-tools -y
sudo netstat -tupn
```
In the example below, the peer `198.51.100.40` from the traffic view appears in a connection owned by PID **28799**. The process name is shown as `xray-linux-amd6`; a process name can be truncated in this view.
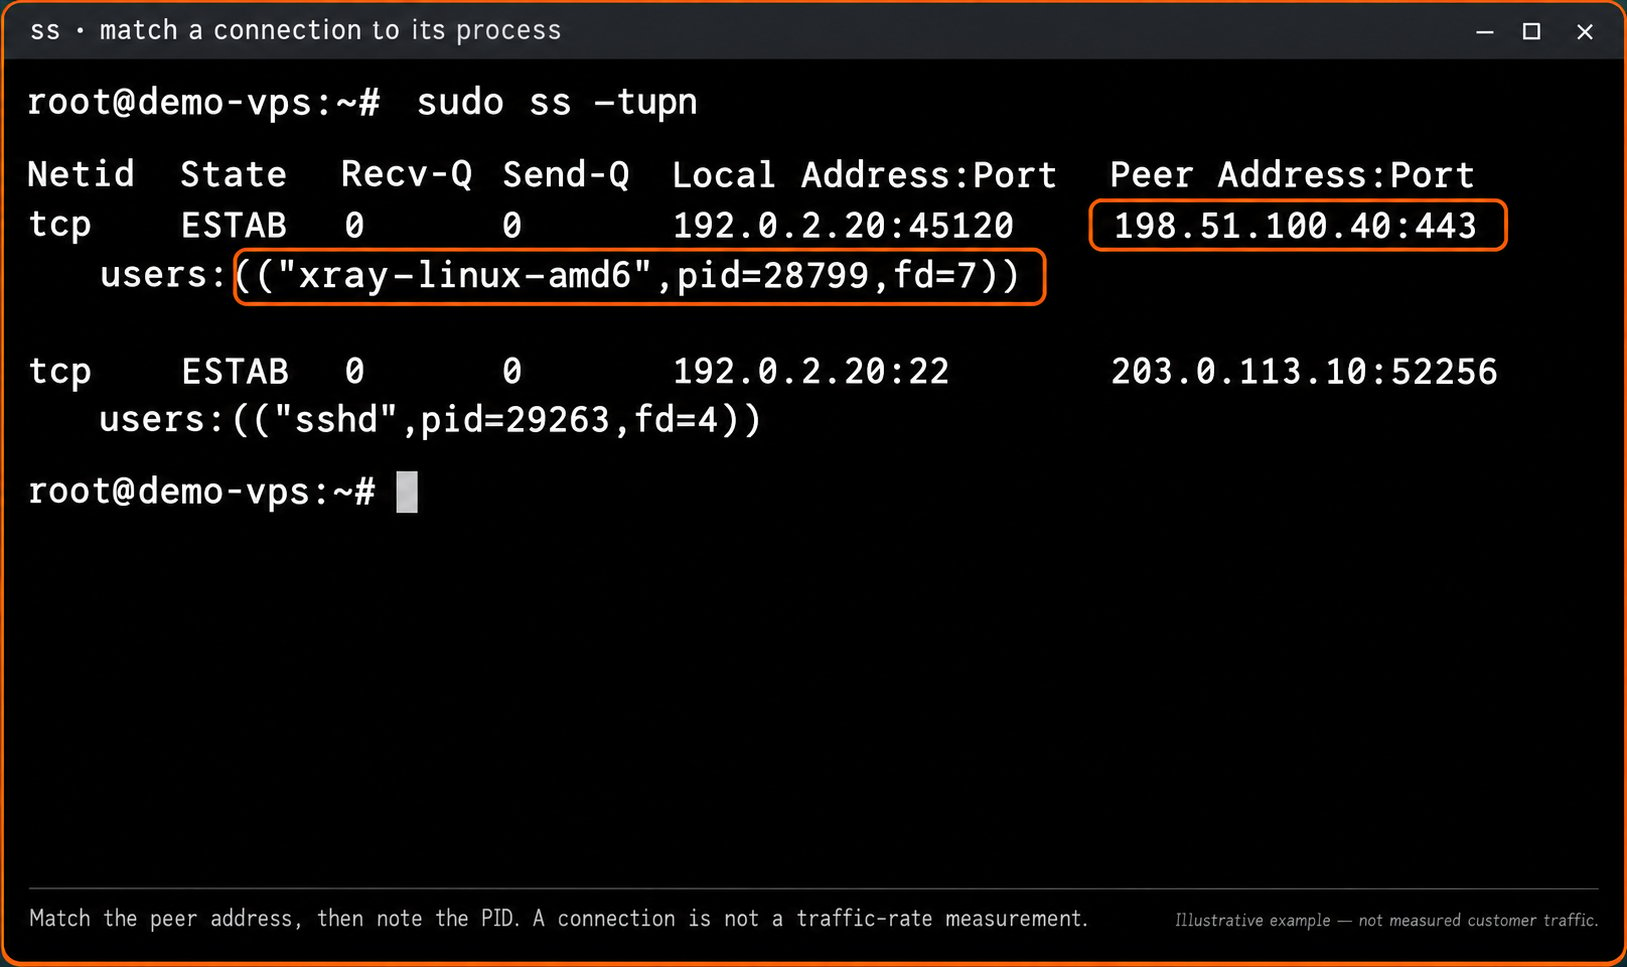 `ss` identifies sockets and their processes; it does not measure their live traffic rates. VPN software such as Xray can legitimately open these connections. Use `nethogs` below to compare rates per process, and check the services you intended to run. See the [ss manual](https://man7.org/linux/man-pages/man8/ss.8.html).
***
## 3) Inspect the suspicious process
Now that you’ve identified the suspicious PID from **`ss`** or **`netstat`**, check what it actually is and where it’s running from.
```bash theme={"system"}
ps -p 28799 -o pid,ppid,user,lstart,args
sudo readlink /proc/28799/exe
sudo cat /proc/28799/cmdline | tr '\0' ' '
```
💡 *Replace **`28799`** with the PID of the process you found suspicious in the previous step.*
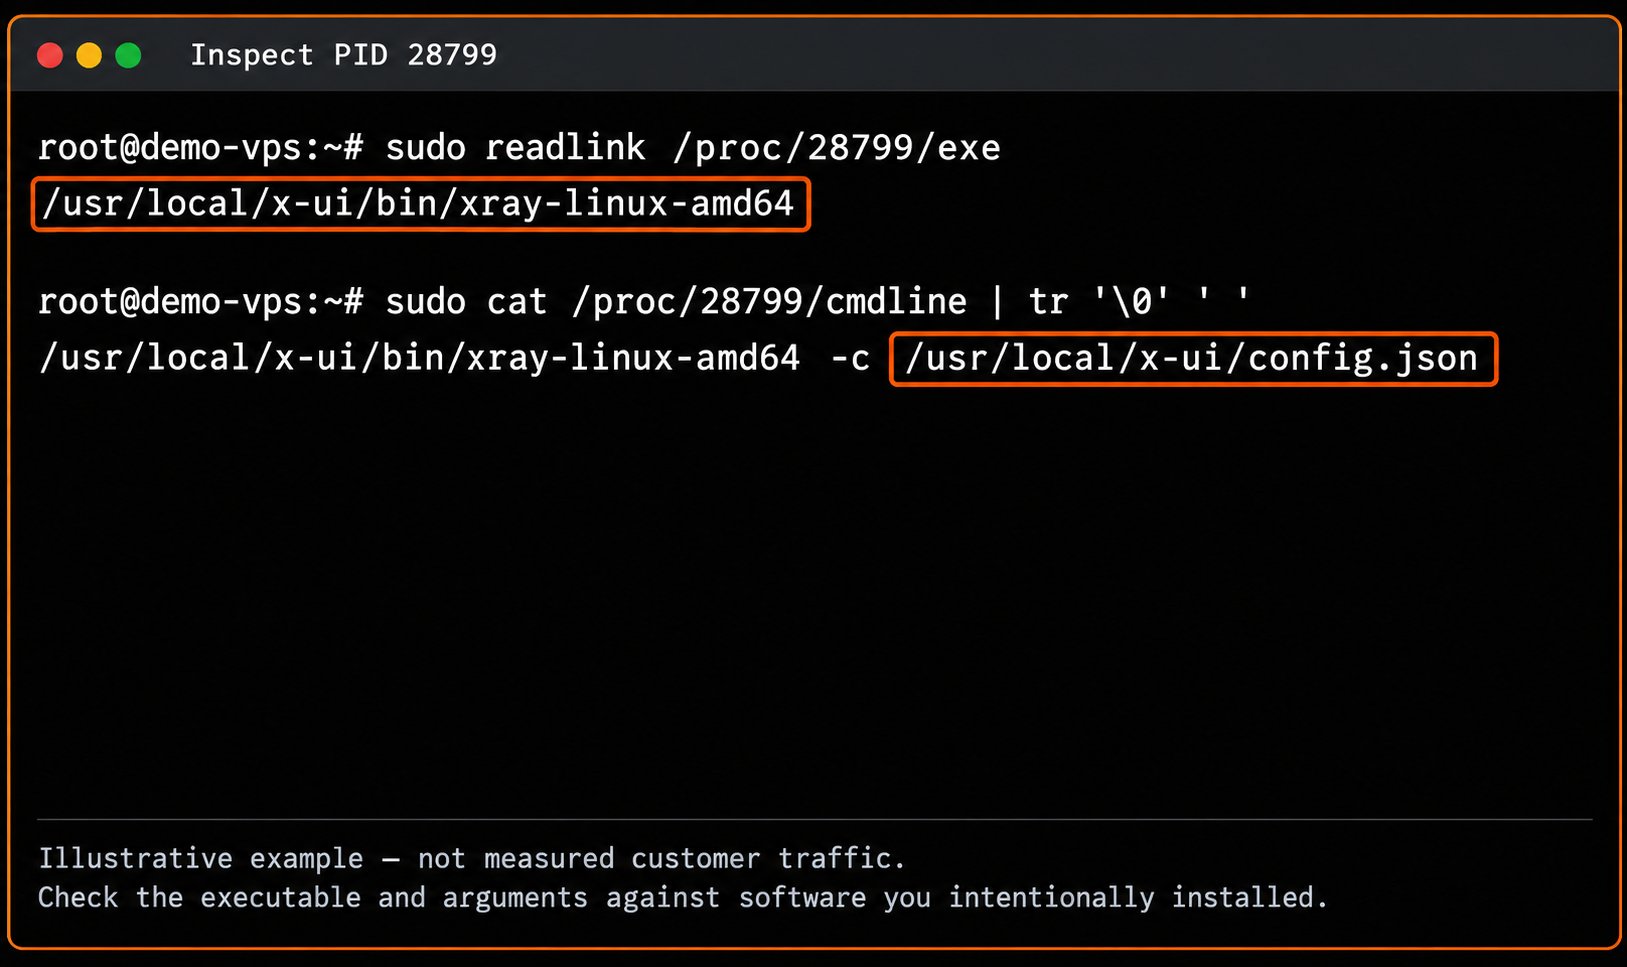
Compare the executable path and arguments with software you installed. A path under `/tmp`, `/dev/shm`, or `/var/tmp` deserves investigation, but its location alone does not prove a compromise.
`ss` identifies sockets and their processes; it does not measure their live traffic rates. VPN software such as Xray can legitimately open these connections. Use `nethogs` below to compare rates per process, and check the services you intended to run. See the [ss manual](https://man7.org/linux/man-pages/man8/ss.8.html).
***
## 3) Inspect the suspicious process
Now that you’ve identified the suspicious PID from **`ss`** or **`netstat`**, check what it actually is and where it’s running from.
```bash theme={"system"}
ps -p 28799 -o pid,ppid,user,lstart,args
sudo readlink /proc/28799/exe
sudo cat /proc/28799/cmdline | tr '\0' ' '
```
💡 *Replace **`28799`** with the PID of the process you found suspicious in the previous step.*
Compare the executable path and arguments with software you installed. A path under `/tmp`, `/dev/shm`, or `/var/tmp` deserves investigation, but its location alone does not prove a compromise.
 ***
## 4) Record evidence, then stop confirmed unwanted activity
A process name, an unfamiliar IP, or a path under `/tmp` is a reason to investigate, not proof of compromise. First establish what the process does and whether it belongs to software you installed.
Record the PID, executable path, command line, start time, connections, and relevant logs **before** stopping the process. If you need to preserve its executable for analysis, do that while it still exists: `/proc/PID/exe` may be unavailable after the process exits. Do not execute a suspicious binary. See the [Linux `/proc/PID/exe` reference](https://man7.org/linux/man-pages/man5/proc_pid_exe.5.html).
If you confirm the activity is unwanted:
* Stop it through its application or service manager when possible. A supervisor may otherwise restart a killed process.
* For a standalone process, `sudo kill -TERM 28799` requests a normal shutdown. Replace the example PID with the one you have just verified. Check whether it exited before considering a forced stop.
* Disable only the confirmed unwanted startup entry after preserving a copy for investigation.
Do not delete an Xray installation, cron job, or executable merely because it matches an example in this article. If the server is compromised, stopping one process is containment, not proof that the system is clean.
***
## 5) Check cron jobs and autostart entries
Many rogue scripts try to restart automatically after reboot using cron or startup files.\
Inspect the following locations carefully:
```bash theme={"system"}
crontab -l
sudo cat /etc/crontab
sudo ls /etc/cron.d/
sudo cat /etc/rc.local
```
Also check these common paths:
```text theme={"system"}
/etc/systemd/system/
/etc/init.d/
/home/*/.bashrc
/home/*/.profile
```
If you find a suspicious entry like this:
```bash theme={"system"}
@reboot sleep 30 && /usr/local/x-ui/bin/xray-linux-amd64 -c /usr/local/x-ui/config.json >/dev/null 2>&1 &
```
or something referencing temporary paths:
```bash theme={"system"}
@reboot /tmp/.miner/start.sh
```
verify whether it belongs to an expected service. If it is confirmed unwanted, preserve a copy and remove or disable that specific startup entry. The Xray example can also be a legitimate VPN configuration.
💡 *Tip:* Legitimate cron jobs usually run system maintenance tasks (like backups or log rotations). Anything starting from `/tmp`, `/dev/shm`, or `/var/tmp` is highly suspicious.
***
## 6) Use nethogs for per-process network tracking
To continuously monitor which processes use the most network bandwidth:
```bash theme={"system"}
sudo apt install nethogs -y
sudo nethogs
```
You’ll see a live list of processes with **sent** and **received** rates. This is perfect for spotting anomalies before they grow.
***
## 4) Record evidence, then stop confirmed unwanted activity
A process name, an unfamiliar IP, or a path under `/tmp` is a reason to investigate, not proof of compromise. First establish what the process does and whether it belongs to software you installed.
Record the PID, executable path, command line, start time, connections, and relevant logs **before** stopping the process. If you need to preserve its executable for analysis, do that while it still exists: `/proc/PID/exe` may be unavailable after the process exits. Do not execute a suspicious binary. See the [Linux `/proc/PID/exe` reference](https://man7.org/linux/man-pages/man5/proc_pid_exe.5.html).
If you confirm the activity is unwanted:
* Stop it through its application or service manager when possible. A supervisor may otherwise restart a killed process.
* For a standalone process, `sudo kill -TERM 28799` requests a normal shutdown. Replace the example PID with the one you have just verified. Check whether it exited before considering a forced stop.
* Disable only the confirmed unwanted startup entry after preserving a copy for investigation.
Do not delete an Xray installation, cron job, or executable merely because it matches an example in this article. If the server is compromised, stopping one process is containment, not proof that the system is clean.
***
## 5) Check cron jobs and autostart entries
Many rogue scripts try to restart automatically after reboot using cron or startup files.\
Inspect the following locations carefully:
```bash theme={"system"}
crontab -l
sudo cat /etc/crontab
sudo ls /etc/cron.d/
sudo cat /etc/rc.local
```
Also check these common paths:
```text theme={"system"}
/etc/systemd/system/
/etc/init.d/
/home/*/.bashrc
/home/*/.profile
```
If you find a suspicious entry like this:
```bash theme={"system"}
@reboot sleep 30 && /usr/local/x-ui/bin/xray-linux-amd64 -c /usr/local/x-ui/config.json >/dev/null 2>&1 &
```
or something referencing temporary paths:
```bash theme={"system"}
@reboot /tmp/.miner/start.sh
```
verify whether it belongs to an expected service. If it is confirmed unwanted, preserve a copy and remove or disable that specific startup entry. The Xray example can also be a legitimate VPN configuration.
💡 *Tip:* Legitimate cron jobs usually run system maintenance tasks (like backups or log rotations). Anything starting from `/tmp`, `/dev/shm`, or `/var/tmp` is highly suspicious.
***
## 6) Use nethogs for per-process network tracking
To continuously monitor which processes use the most network bandwidth:
```bash theme={"system"}
sudo apt install nethogs -y
sudo nethogs
```
You’ll see a live list of processes with **sent** and **received** rates. This is perfect for spotting anomalies before they grow.
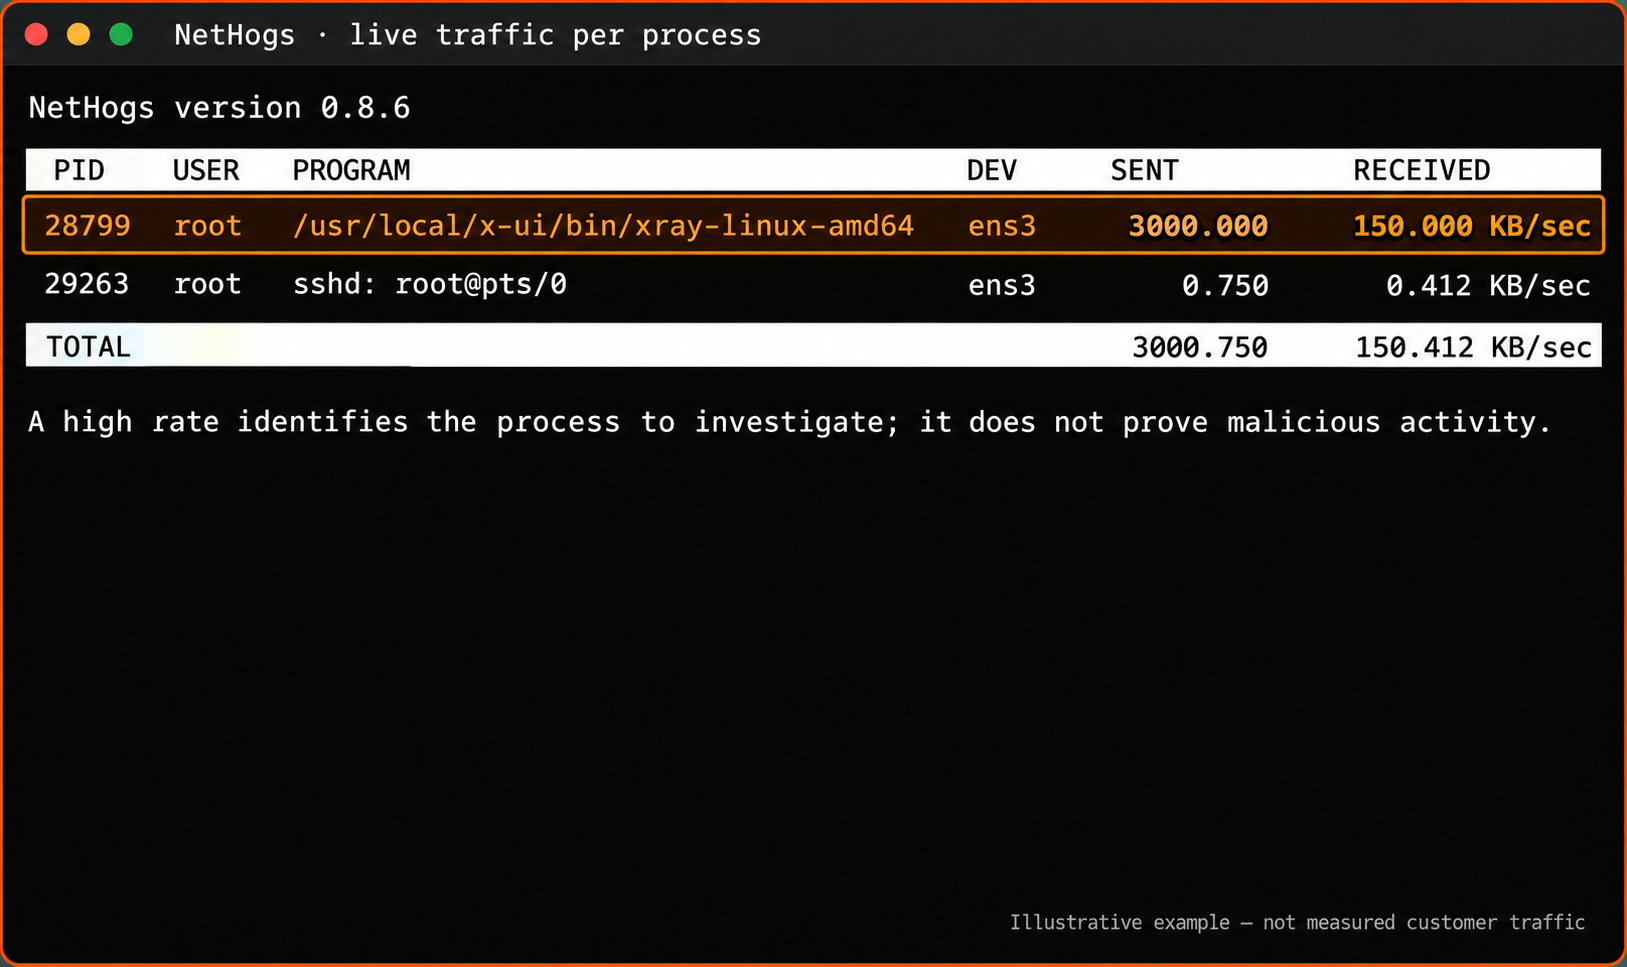 Compare the PID with the earlier `ss` output. Note the units: **KB/sec is bytes per second**, whereas iftop normally shows rates in bits per second. See the [NetHogs project](https://github.com/raboof/nethogs).
***
## 7) Check your overall network usage
If you suspect something has already used too much data, you can review your usage stats directly in your EDIS dashboard.\
It shows **total monthly usage**, **daily graphs**, and **refill times**.
📘 [Learn how EDIS Global measures network usage and refill cycles here](https://docs.edisglobal.com/faq/traffic-bandwidth/traffic-stats-refill-explained).
***
## 8) Recover and prevent recurrence
For an application fault, fix its configuration or update it, then monitor whether traffic returns to the expected rate.
If you confirm a compromise, preserve the evidence you need, contain the affected service, rotate exposed credentials from a trusted device, and plan a clean rebuild from known-good software and data. A reduced traffic graph does not establish that all unauthorized access has been removed.
Review updates, exposed services, and [SSH access controls](/getting-started/ssh-security-hardening-guide). Firewall rules should target the traffic you actually intend to allow; UFW does not identify a malicious process by name. Changes such as `noexec` mounts are not a substitute for investigating how the activity began.
For cumulative usage, refills, and the shared reserve, see [Traffic statistics](/faq/traffic-bandwidth/traffic-stats-refill-explained) and [Traffic Pool](/faq/traffic-bandwidth/traffic-pool).
## Related topics
- [How to react when receiving an abuse message](/responding-to-abuse-complaints.md)
- [Linux Secure Shell (SSH)](/getting-started/linux-secure-shell-ssh.md)
- [Network is down (Linux server)](/faq/ip-addresses/network-is-down.md)
- [Traffic usage](/management-api-reference/collect-information/get-traffic-usage.md)
- [Linux rescue CD guide: fix network, firewall, and SSH issues](/vps-management/linux-rescue-guide-and-troubleshoot.md)
Compare the PID with the earlier `ss` output. Note the units: **KB/sec is bytes per second**, whereas iftop normally shows rates in bits per second. See the [NetHogs project](https://github.com/raboof/nethogs).
***
## 7) Check your overall network usage
If you suspect something has already used too much data, you can review your usage stats directly in your EDIS dashboard.\
It shows **total monthly usage**, **daily graphs**, and **refill times**.
📘 [Learn how EDIS Global measures network usage and refill cycles here](https://docs.edisglobal.com/faq/traffic-bandwidth/traffic-stats-refill-explained).
***
## 8) Recover and prevent recurrence
For an application fault, fix its configuration or update it, then monitor whether traffic returns to the expected rate.
If you confirm a compromise, preserve the evidence you need, contain the affected service, rotate exposed credentials from a trusted device, and plan a clean rebuild from known-good software and data. A reduced traffic graph does not establish that all unauthorized access has been removed.
Review updates, exposed services, and [SSH access controls](/getting-started/ssh-security-hardening-guide). Firewall rules should target the traffic you actually intend to allow; UFW does not identify a malicious process by name. Changes such as `noexec` mounts are not a substitute for investigating how the activity began.
For cumulative usage, refills, and the shared reserve, see [Traffic statistics](/faq/traffic-bandwidth/traffic-stats-refill-explained) and [Traffic Pool](/faq/traffic-bandwidth/traffic-pool).
## Related topics
- [How to react when receiving an abuse message](/responding-to-abuse-complaints.md)
- [Linux Secure Shell (SSH)](/getting-started/linux-secure-shell-ssh.md)
- [Network is down (Linux server)](/faq/ip-addresses/network-is-down.md)
- [Traffic usage](/management-api-reference/collect-information/get-traffic-usage.md)
- [Linux rescue CD guide: fix network, firewall, and SSH issues](/vps-management/linux-rescue-guide-and-troubleshoot.md)